Assessments and Data Resources
The FCSS Data and Assessment department is committed to offering valuable resources and opportunities to support your LEA in making informed, data-driven decisions. We strive to foster a welcoming environment where our LEAs and partners feel genuinely supported and encouraged on their data journey.

Data Literacy & Leadership Resource Hub
Take a look at what our partners are developing in the areas of curated visualization, analysis, communication, and storytelling tools to support you and your LEA site.
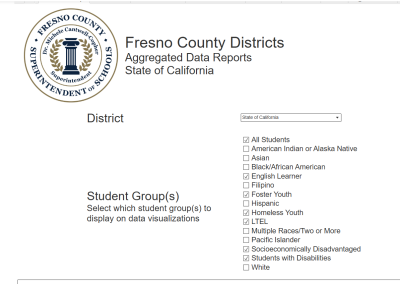
FCSS Differentiated Assistance Dashboard
Publicly available data is commonly used with differentiated assistance eligible districts. County-level data is an approximation using average district performance.
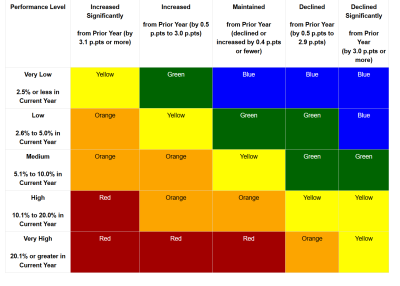
CDE Five-by-Five Colored Tables
Performance Levels (or colors) for state indicators are determined using current year performance (or Status) and the difference from prior year (or Change) to show growth or decline. This results in five color-coded Performance Levels for each indicator. From highest to lowest, the Performance Levels are: Blue, Green, Yellow, Orange, and Red.
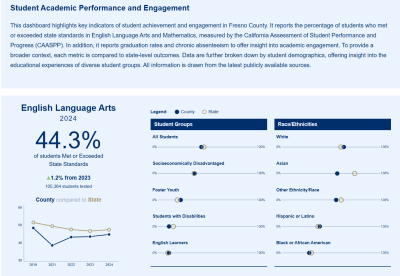
FCSS Student Outcomes Dashboard
The Fresno County Superintendent of Schools provides a comprehensive overview of students' academic performance in key areas like English Language Arts and Mathematics, based on California state test results.